I’ve just launched my dashboard designed to make navigating EU law-making more intuitive.
A quick overview of what you can do with this new tool. This post highlights the landing page, but there is already more to explore.
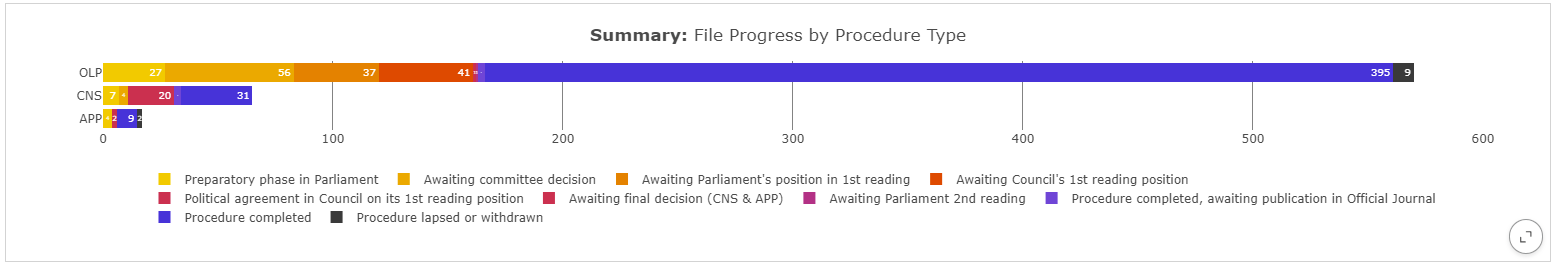
The EU’s legislative pipeline at a glance
At the very top, the dashboard opens with three key figures, giving you a quick pulse check on EU law-making:
New proposals: number of legislative files introduced in the past month
Pending: number of proposals currently moving through the legislative process
Completed: number of proposals that became law in the past month

These numbers are then broken down by progress stage and procedure type. This lets you see not only how many files are active, but also where they are in the legislative process and what procedures they follow.
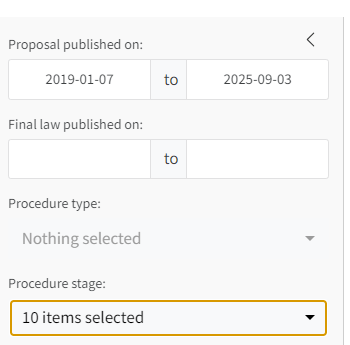
Filter by procedure type and procedure stage
The current dataset covers 652 files proposed since January 2019, of which 435 have been adopted.
I now cover three key procedures for adopting EU law:
- OLP: Ordinary Legislative Procedure (most used)
- CNS: Consultation Procedure
- APP: Consent Procedure
The sidebar lets you filter by procedure type and stage. You can also select when the legislative proposal and final law have been published.
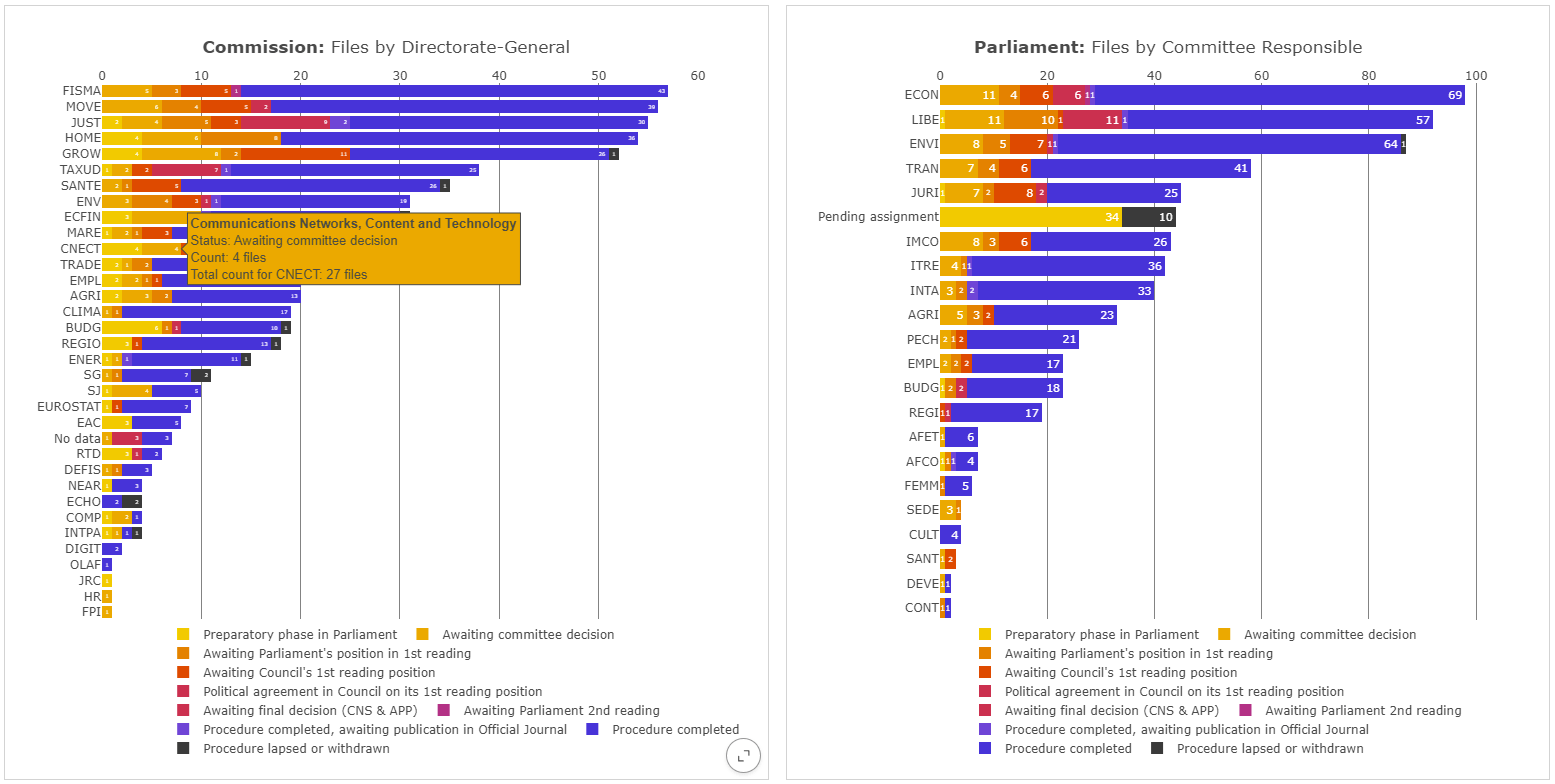
Breakdown by actors
In the next row, the data is broken down further to show you which actors are leading the law-making process.
This currently covers Directorate-Generals (DGs) of the European Commission and relevant committees in the European Parliament. I am planning to add Council bodies, too.
Hovering over each bar shows you more information – and explains the many confusing acronyms!
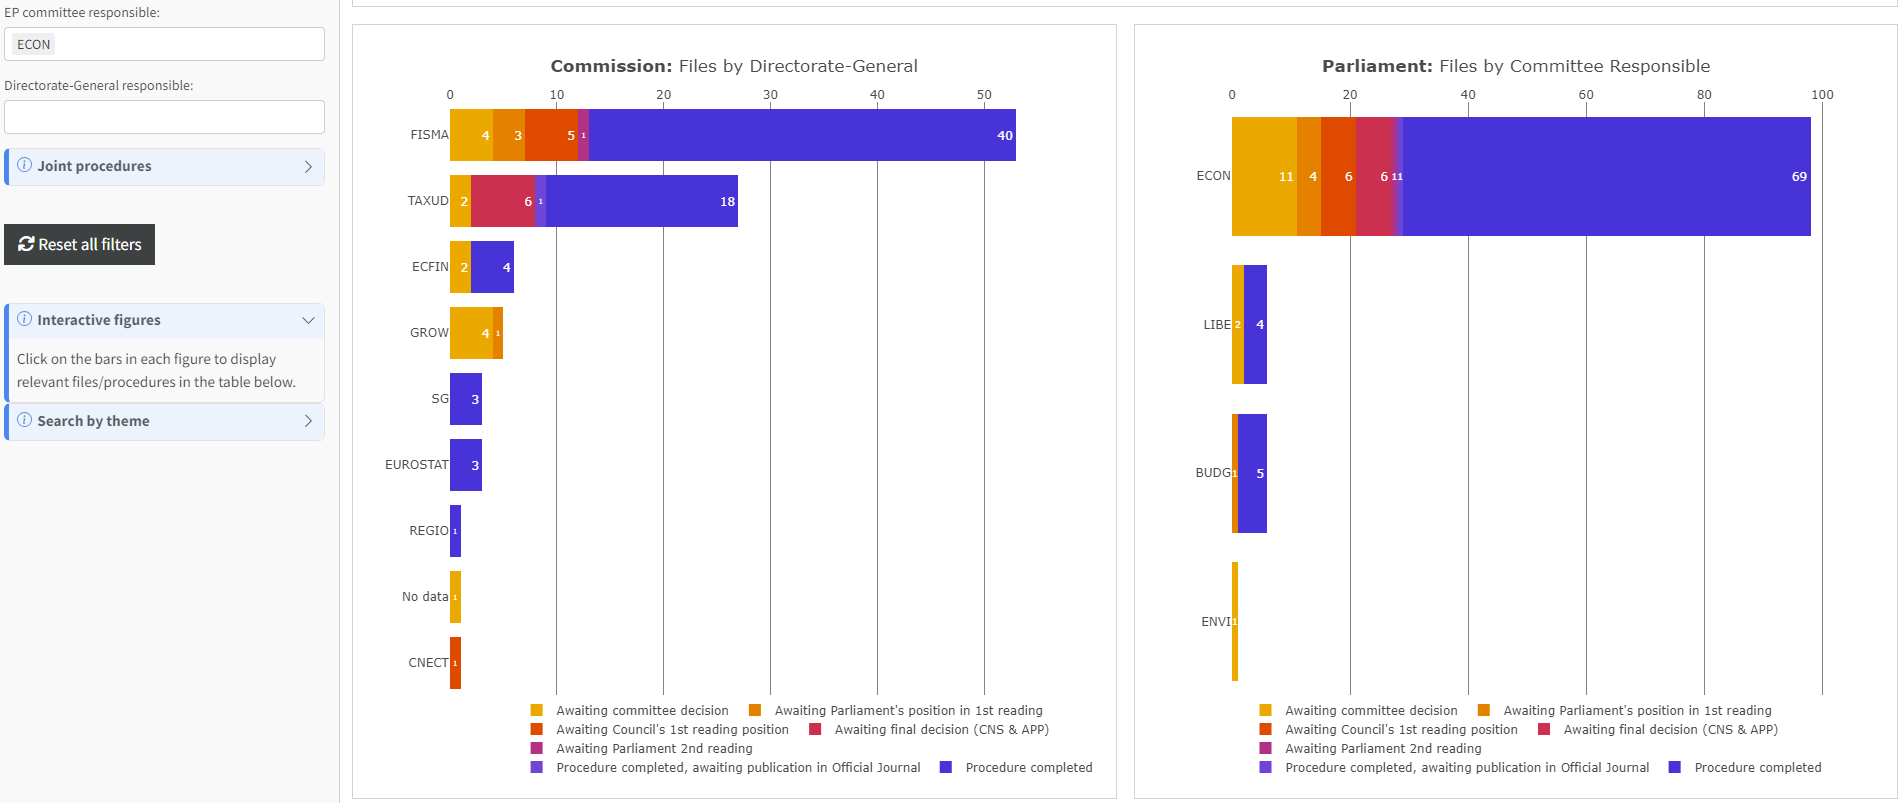
Filter by actors
Use the sidebar to filter the figures by specific actors. This makes it easy to see which committees/DGs are working together on particular laws.
For example, the result of filtering for activity of the Parliament’s Economic and Monetary Affairs committee (ECON) looks like this. Multiple other committees and DGs are shown because they work with ECON on certain files.
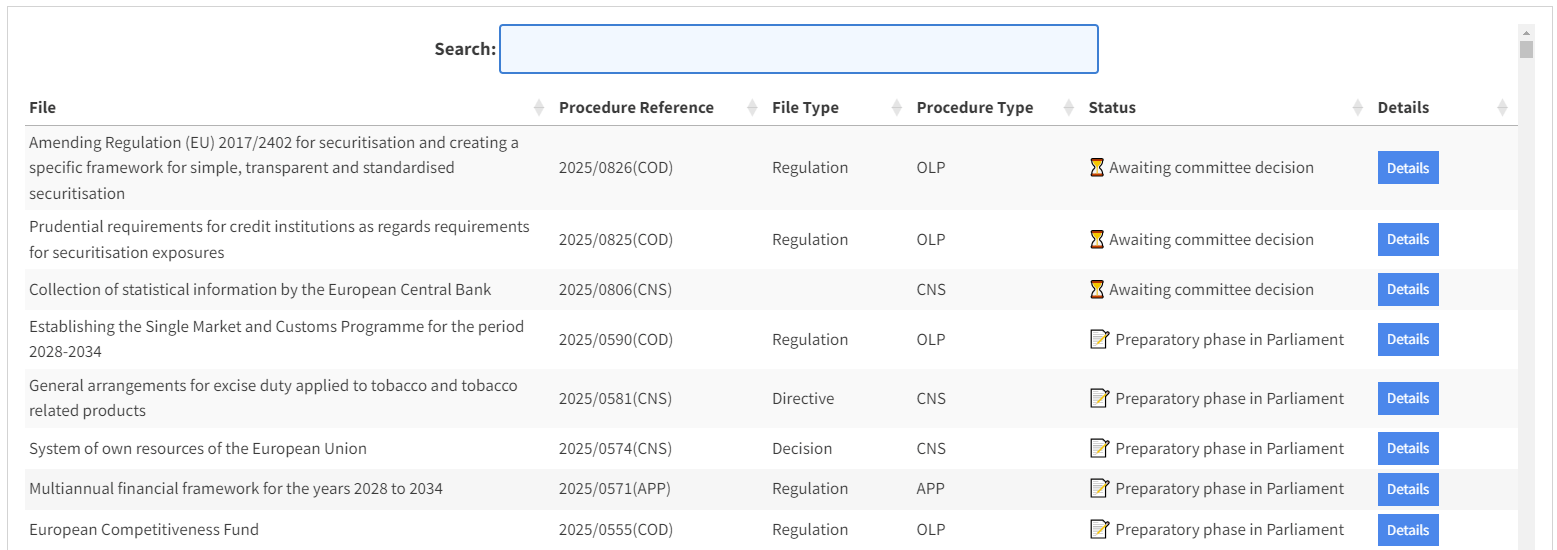
View and search relevant files
All figures are interactive. Click on a bar to display the corresponding procedures in the table below, which offers even further detail on each legislative file.
You can also use the table to search for relevant files by using titles, references or keywords.
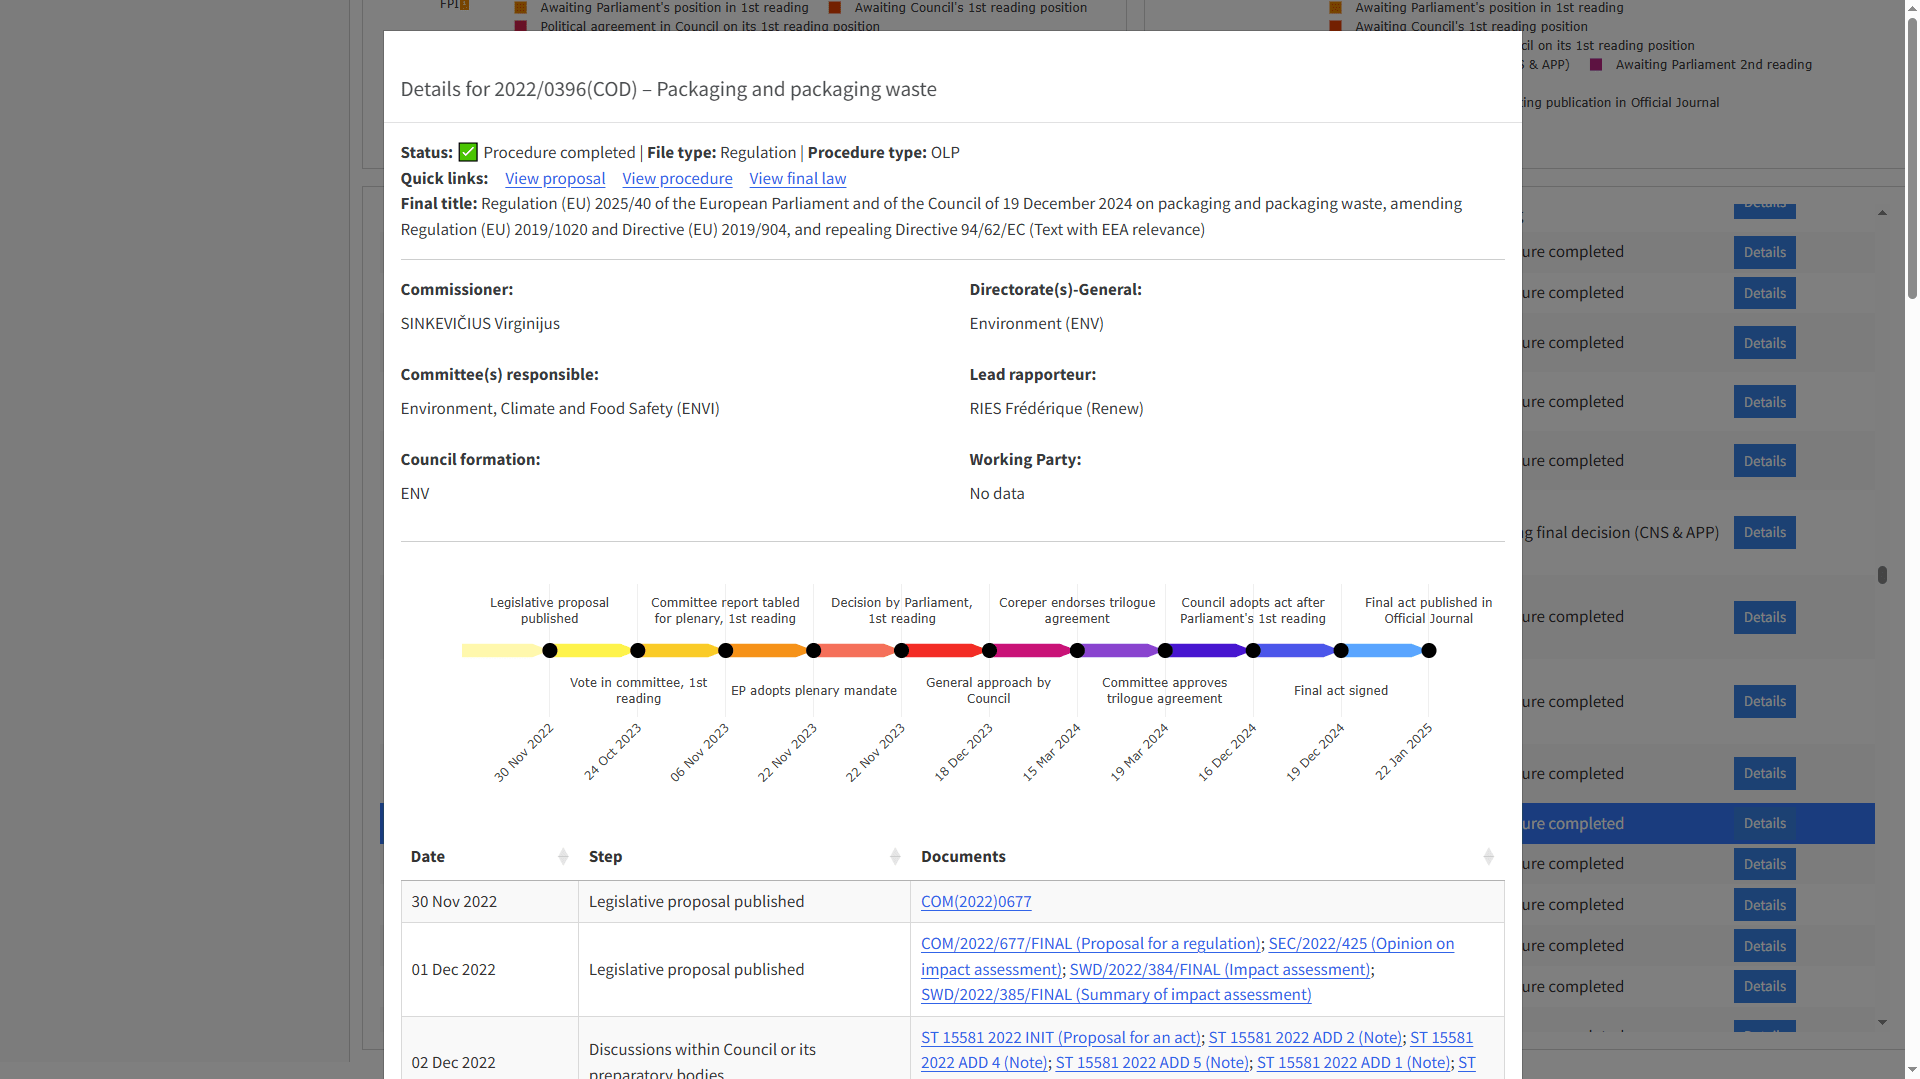
Zoom in on individual procedures
But there’s more. The dashboard offers a lot more detail on each procedure if you need it.
Click the Details button in the table to trace the proposal’s legislative journey.
My application will dynamically map the legislative process step by step, highlighting key events where data is available. Tables provide even more procedure steps, with links to official documents where possible.
More to come – and already here
This is just the first page and only the beginning. I will explain more features in the next posts and the dashboard will continue to grow as I add more functionality and data.
👉 Explore the application here
Try it and help shape its development by sending your feedback. And if you like what you see, please spread the good news.

One response to “Tracking EU legislation made easy”
[…] Coming next: a series of posts that explain each page of the new application in detail: Part 1; Part […]
LikeLike