Working across a wide range of Single Market and competitiveness issues, I have often found myself missing clear, regularly updated statistics on the progress of EU law-making.
For such a complex legislative system, it is (at least to me) surprisingly difficult to get a high-level picture of the legislative pipeline – what is the current status of files, who is responsible, and what steps are coming up next. Not just for individual files, but in general. The lack of summary statistics makes it harder to coordinate work(load) across files, anticipate key moments, or just stay on top of the bigger picture.
So I built my own legislative dashboard.
Example: OLP files
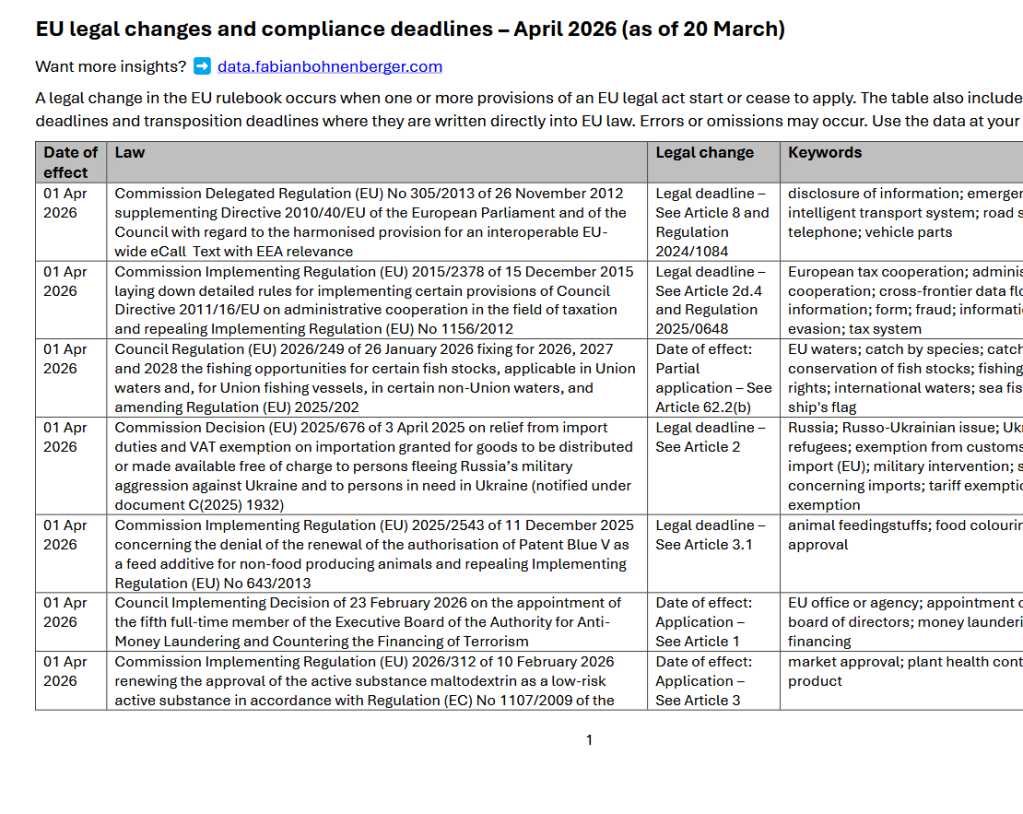
I started compiling structured, up-to-date figures to track all active files – broken down, for example, by where they are in the process and which Commission service(s) or Parliamentary committee(s) are in the lead.
Here is a current snapshot of some statistics on the Ordinary Legislative Procedure (OLP) – now the main process to adopt EU legislative acts:

How to interpret these figures
I explain the process stages – denoted by the colours – here. (There is scope for improvement because this official classification is not easy to interpret.)
If you are lost in the acronym soup, I understand. The official names of Commission services and parliamentary committees are too long for the figures. But if you want to look them up, see here: European Commission departments and European Parliament committees.
Take into account:
- Files still in the preparatory phase in Parliament do not appear on the right hand side because they have not yet been assigned to one or more committees.
- There is some double counting in the figures for the Commission and the Parliament because a proposal can have multiple lead departments or committees, especially for cross-cutting files.
- Not all data is always available, so some files are still missing from the more detailed breakdowns.
This work is part of a bigger effort to bring structure and clarity to the EU legislative process – especially for those of us engaging across silos.
Got feedback or ideas? Let me know.

3 responses to “EU Law-Making in Numbers”
[…] up on last week’s post, some readers asked if I could break down the data further – this time by political groups in the […]
LikeLike
[…] to help me with this is a dynamic report based on my dataset of EU legislative files – introduced here and here. The report contains some fairly basic but essential information about each legislative […]
LikeLike
[…] 📊 A dashboard with data on EU law-making, including the current status of legislative files, and the responsible actors. (link) […]
LikeLike